Landslide Hazard Zonation

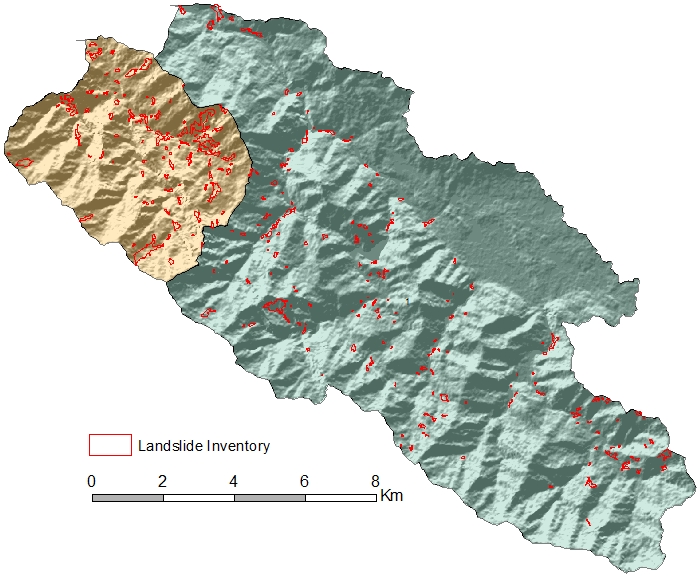
The process of landslide hazard mapping requires information regarding the distribution of landslides in space and their temporal history along with the knowledge of factors that contributes in the process of slope failures. The contributing factors includes geology, topography, climatic conditions, geomorphology, land use land cover information, and anthropogenic disturbances of the location of interest. Images of those factors should be classified into suitable categories as the contribution may varies from one location to another. Here the inventory of landslides can be produced from the digitization of existing maps, field surveys or can be extracted from satellite imageries.

Landslide inventory done by semi-automatic feature extraction method from Sentinel-2 images

Once the know-how of the landslides and their contributing factors is finalized into image layers, it is required to generate a relation between them. There are several ways that can relate landslides to their contributing factors. Some to name are analytical hierarchy process, weighted linear combination, statistical index method, weight of evidence, frequency ratio, logistic regression analysis, and so on. This relation develops the weight values for each categories of individual factor and values varies according to the influence of particular factor class in causing landslides.  The weights values should be estimated for all factors and each factor class should be assigned with this value.

The image layers of all factors are summed up on the basis of weight values which results into single image showing distribution of landslide hazard. The sum of weight values give rise to a single image with an index, where lower values resembles area with less landslide hazard and higher values shows area with greater landslide hazard.

The flowchart for the process of landslide susceptibility mapping

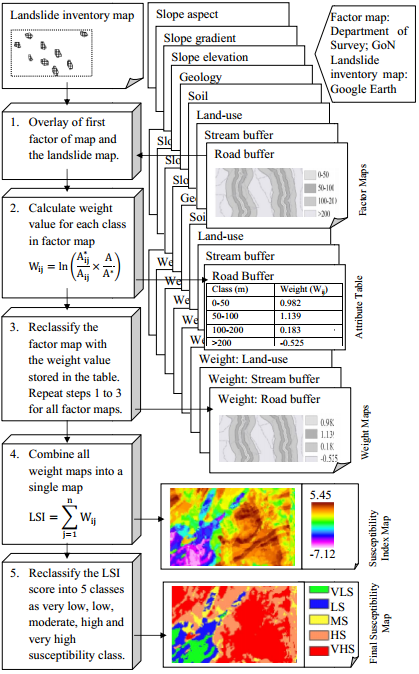
The index can be standardized from zero to one and further classified to produce categorized landslide hazard zonation map. Generally hazard zonation map are categorized into five classes as very less hazard, less hazard, moderate hazard, high hazard, and very high hazard zones. High and very high hazard zones are the results of combination of factor classes with greater weight values. Also, they resembles area where the potential of landslides occurrence is high in the future.

-Padam Bahadur Budha

Author is independent researcher and this blog is part of his M.Sc. dissertation conducted in 2015.

Remote Sensing: Introduction

Remote Sensing (RS) is the most prominent technique of collecting information from distance. So collected data are remotely sensed data. It is science of acquiring information about the earth’s surface without actually being in physical contact with the surface. There are various categories of remote sensing starting from observation by naked eyes, photography by camera, photography from aircraft, and sensing by sensors from space satellite.

Some definitions

  • “Remote sensing is the science (and to some extent, art) of acquiring information about the Earth’s surface without actually being in contact with it. This is done by sensing and recording reflected or emitted energy and processing, analyzing, and applying that information. “
  • The term “remote sensing” means the sensing of the Earth’s surface from space by making use of the properties of electromagnetic waves emitted, reflected or diffracted by the sensed objects, for the purpose of improving natural resources management, land use and the protection of the environment (UN, 1986).

Electromagnetic Spectrum

The first requirement for remote sensing is to have an energy source to illuminate the target (unless the sensed energy is being emitted by the target). This energy is in the form of electromagnetic radiation (EMR). All electromagnetic radiation has fundamental properties and behaves in predictable ways according to the basics of wave theory. Electromagnetic radiation consists of an electrical field (E) which varies in magnitude in a direction perpendicular to the direction in which the radiation is traveling, and a magnetic field (M) oriented at right angles to the electrical field. Both these fields travel at the speed of light (c).

Two characteristics of electromagnetic radiation are particularly important for understanding remote sensing. These are the wavelength and frequency and are reciprocal to each other in relation. The wavelength is the length of one wave cycle, which can be measured as the distance between successive wave crests. Frequency refers to the number of cycles of a wave passing a fixed point per unit of time.

The electromagnetic spectrum ranges from the shorter wavelengths (including gamma and x-rays) to the longer wavelengths (including microwaves and broadcast radio waves). There are several regions of the electromagnetic spectrum which are useful for remote sensing.

Following are the regions of electromagnetic spectrum mostly used in remote sensing

  • the ultraviolet or UV 
  • visible spectrum
  • infrared (IR) region
  • microwave region

Generalized process of Remote Sensing

  1. Energy Source (A):
    A source of energy which illuminates or provides electromagnetic radiation to the target of interest. This may be the sun or the source borne by the platforms.
  2. Radiation and the Atmosphere (B):
    During transmission of radiation from source to target (ground) it will be intervened by the atmosphere it passes through. This interaction may take place again after energy is reflected or scattered back from the target for second time.
  3. Interaction with the Target (C):
    The target can be different surface covers of the earth ground the interaction of incoming radiation can be absorption, reflectance, and transmission. These targets can emit their own energy as well.
  4. Recording by Sensor (D):
    The sensors attached to the platform (like satellites, UAVs) for capturing and recording the energy that come there. The incoming energy can be reflected, scattered, or emitted by targets.
  5. Transmission (E):
    The recording of the sensor is transmitted to the ground station either directly or through another nearby support satellite.
  6. Reception, and Processing (F):
    The data received undergo preprocessing and generate products which can be used by analysts. The preprocessed data can be distributed as photographs or digital products.
  7. Interpretation and Analysis (G):
    The processed image is interpreted, visually and/or digitally to extract information about the target.
  8. Application (H):
    Dissemination and use of the information extracted from the imagery about the target to solve a particular problem.

Types of Remote Sensing

There are two types of remote sensing technology based on source of EMR, 

  1. active remote sensing,
    An active remote sensing system supplies its own source of energy to illuminate the objects and measures the reflected energy returned to the system (similar to photography in night with flash).Active sensors emit energy in order to scan objects and areas whereupon a sensor then detects and measures the radiation that is reflected or back-scattered from the target.  RADAR and LiDAR are examples of active remote sensing.
  2. passive remote sensing
    In passive remote sensing system, the naturally radiated or reflected energy from the earth’s surface features is measured by the sensors operating in different selected spectral bands on board the air-borne/space-borne platforms (similar to photography in daytime without flash). Examples of passive remote sensors include film photography, infrared, charge-coupled devices, and radiometers.
    Passive sensors gather radiation that is emitted or reflected by the object or surrounding areas. Reflected sunlight is the most common source of radiation measured by passive sensors.

Geographic Information System: Introduction

GIS stands for Geographical Information System. As the name suggests, GIS is an information system dealing with geographic information. The term “geographic information” is the key word here. Anything which pertains to geography is geographic. Geography is science that studies the lands, the features, the inhabitants, and the phenomena of the Earth (Wikipedia). A literal translation would be “to describe or write about the Earth”. Therefore the term geographic information would mean any information that is geographic in nature or that pertains to some features on earth is geographic information. 

The  system  or  toolset  designed  to  deal  with geographic  information  can  therefore  be  called  as  geographic  information  system  and  the science and art of dealing with it  as geographical information science.

Some definitions

  • “A  computer  –  assisted  system  for  the  capture,  storage  retrieval,  analysis  and display of spatial data, within a particular Organization” (Clarke, 1986).
  • “A powerful set of tools for collecting, storing, retrieving at will, transforming and displaying spatial data from the real world” (Burrough, 1987).’’
  • A  GIS  is  a  computer-based  system  that  provides  the  following  four  sets  of capabilities  to  handle  geo-referenced  data,  i.e.  input,  data  management  (data storage and retrieval), manipulation and analysis, and Output.(Aronoff, 1989)
  • “An internally referenced, automated, spatial information system” (Berry, 1986).

Components of GIS

The hardware here is the computing system that can be either hand-held devices, stand-alone computers, or server-user network with many units. Hardware aids in storage, analysis, interpretation, and display of data containing geographic information. In addition to computers, there is important roles of other hardware like GPS, scanners, and sensors that help to collect the data necessary for GIS.

The software part consists of different functions that are capable of analyzing and manipulating the data so as to provide unique solutions to the specific problems. Besides, software can be considered as tools to store, retrieve, and display the data. GIS software lets you produce maps and other graphic displays of geographic information for analysis and presentation.

Data in GIS refers to the information of a location that can be point structures, area of an entity or linear features. Such data have the spatial extent containing the geographic location. The attributes of such spatial data consists of various related information of use. 

Such data can undergo a process to be analyzed by different functions and tools so that relevant information can be extracted and displayed. Basic processes in GIS consist of measurements, monitoring, modelling, mapping, manipulating, and so on.

People are the users and communities who are using GIS for solution of their everyday problems. They may be data collectors who do field measurements, data analysts who interpret and manipulate the collected data, or communities whose requires GIS based solutions for their geographical issues.

Workflow in GIS

  1. Data acquisition and verification (input)
  2. Data storage and management systems (DBMS)
  3. Data analysis and interpretation (process)
  4. Data products and presentation (output)
Design a site like this with WordPress.com
Get started