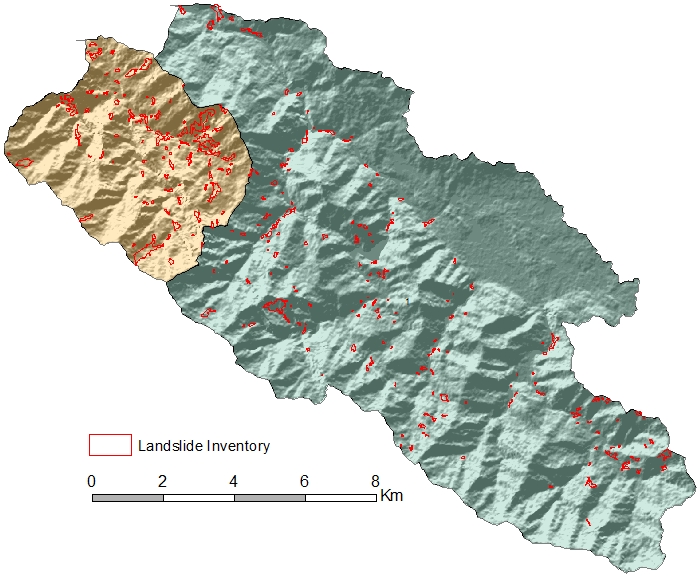
The process of landslide hazard mapping requires information regarding the distribution of landslides in space and their temporal history along with the knowledge of factors that contributes in the process of slope failures. The contributing factors includes geology, topography, climatic conditions, geomorphology, land use land cover information, and anthropogenic disturbances of the location of interest. Images of those factors should be classified into suitable categories as the contribution may varies from one location to another. Here the inventory of landslides can be produced from the digitization of existing maps, field surveys or can be extracted from satellite imageries.

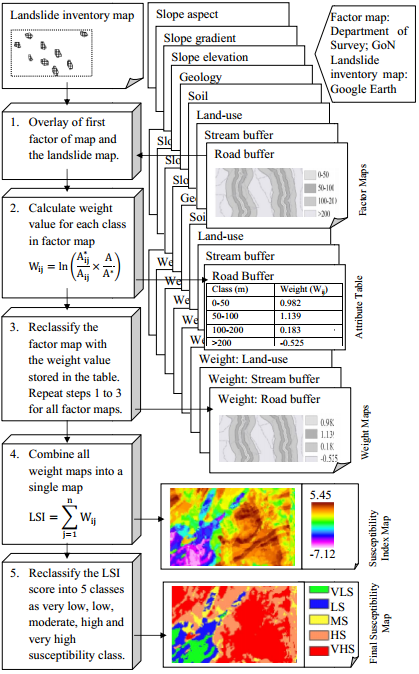
Once the know-how of the landslides and their contributing factors is finalized into image layers, it is required to generate a relation between them. There are several ways that can relate landslides to their contributing factors. Some to name are analytical hierarchy process, weighted linear combination, statistical index method, weight of evidence, frequency ratio, logistic regression analysis, and so on. This relation develops the weight values for each categories of individual factor and values varies according to the influence of particular factor class in causing landslides. The weights values should be estimated for all factors and each factor class should be assigned with this value.
The image layers of all factors are summed up on the basis of weight values which results into single image showing distribution of landslide hazard. The sum of weight values give rise to a single image with an index, where lower values resembles area with less landslide hazard and higher values shows area with greater landslide hazard.

The index can be standardized from zero to one and further classified to produce categorized landslide hazard zonation map. Generally hazard zonation map are categorized into five classes as very less hazard, less hazard, moderate hazard, high hazard, and very high hazard zones. High and very high hazard zones are the results of combination of factor classes with greater weight values. Also, they resembles area where the potential of landslides occurrence is high in the future.
-Padam Bahadur Budha
Author is independent researcher and this blog is part of his M.Sc. dissertation conducted in 2015.